dms-view
Interactive visualization tool for deep mutational scanning experiments.
Try out dms-view!//dms-view.github.io
Getting startedTutorial
Upload your own data
Case studies
Deep Mutational Scanning primer
Deploy or develop dms-view
Deep Mutational Scanning primer
dms_view was designed to facilitate the analysis of deep mutational scanning experiments.
However, there are other datasets which might also be suitable for dms_view.
Here, we will go into a brief introduction to deep mutational scanning to help contextualize the data upload instructions.
Deep mutational scanning experiments
Deep mutational scanning is a high-throughput functional assay that measures the effect of every genetic change at every site in a protein.
Below is an outline of a deep mutational scanning experiment looking at how antibodies bind to viruses.
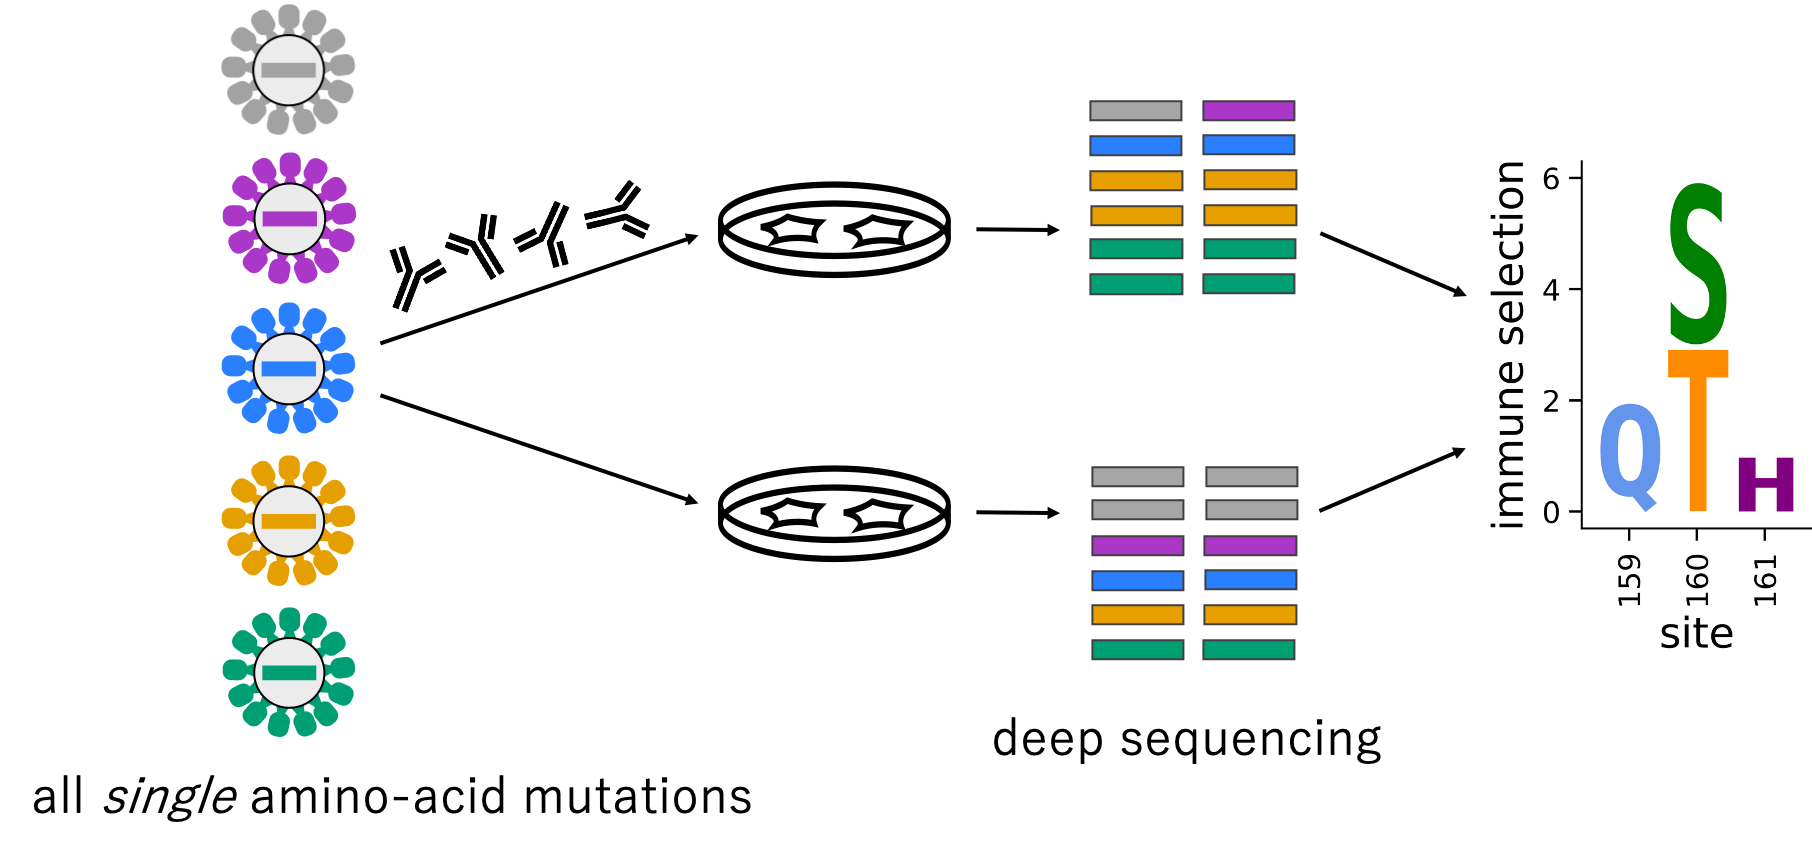 First, you introduce genetic changes at each site in a protein/gene.
For example, mutagenizing the gene to introduce every possible amino-acid change away from wildtype (19 mutations per site).
Next, you grow up a library of protein variants.
Then, you impose some sort of functional selection such as growth in cell culture or growth in the presence of antibodies.
Finally, you use deep sequencing to count the variants after selection and calculate each variants enrichment or depletion.
First, you introduce genetic changes at each site in a protein/gene.
For example, mutagenizing the gene to introduce every possible amino-acid change away from wildtype (19 mutations per site).
Next, you grow up a library of protein variants.
Then, you impose some sort of functional selection such as growth in cell culture or growth in the presence of antibodies.
Finally, you use deep sequencing to count the variants after selection and calculate each variants enrichment or depletion.
Deep Mutational Scanning final data matrix
The data of a deep mutational scan can be summarized in L sites X M mutations dataframe. For example, you performed a deep mutational scan on the amino-acid level for a 500 residue protein, the results would look something like this:
| A | C | D | … | Y | * | |
|---|---|---|---|---|---|---|
| 1 | 0.50 | 0.50 | 0.49 | … | 0.46 | 0.45 |
| 2 | 0.78 | 0.03 | 0.01 | … | 0.03 | 0.20 |
| 3 | 0.07 | 0.14 | 0.08 | … | 0.04 | 0.08 |
| … | … | … | … | … | … | … |
| 500 | 0.11 | 0.02 | 0.10 | … | 0.13 | 0.07 |
For each site (row), you would have a measurement for each amino acid (column).
Converting dms data to dms-view format
dms_view is a flexible tool for data exploration.
This means that it does not simply accept the output of a deep mutational scan and calculate standard metrics but instead the tool display whichever metrics the user chooses. For a complete discussion of the input file format, please see the data upload page but below we will touch on how three different aspects of the data input file format map to the experiment outlined above. Finally, you can view the final dms_view input data file.
mutation-level metrics
The dataframe above is one way to represent the mutation-level metrics. Each site has measurements for multiple variants.
However, dms_view does not require that there is only mutation-level metric or that the mutation-level metric is from a deep mutational scan.
For example, you could use the mutation plot dropdown menu to toggle between deep mutational scanning data and the frequency of amino acids in nature.
site-level metrics
For the site-level metrics, the L sites X M mutations matrix is collapsed to a L site X 1 matrix. So each site has only one summary value.
| site_mean | |
|---|---|
| 1 | 0.09 |
| 2 | 0.2 |
| 3 | 0.17 |
| … | … |
| 500 | 0.25 |
For a deep mutational scanning experiment, common site-level metrics include entropy, effective number of amino acids, or simply the min/max value at a given site.
In dms_view, you can access different site-level metrics using the site plot dropdown menu.
conditions
Deep mutational scans can be designed with different selective pressures (conditions).
In the experiment cartoon above, this could be different cell types or different antibodies.
Each condition produces a different L sites X M mutations matrix.
In dms_view, you can access different conditions using the condition dropdown menu.